Introduction:
The Texas Election Commission is interested in analyzing election patterns for the state of Texas throughout the last 20 years. The state of Texas is predominantly concerned about clustering of particular voting patterns and whether or not these patterns have remained consistent over the last 20 years. Percent democratic vote and voter turnout data for both 1980 and 2008 elections have been analyzed to determine whether or not clustering is occurring in Texas, as well as if similar voting patterns are consistent over 20 years. Furthermore, the Texas Election Commission wants to know, if clustering is occurring, whether or not certain population variables influence certain patterns. Therefore data regarding percent Hispanic population in Texas has been used in relation to the voting data, considering Texas’s significant Hispanic population. After statistical and spatial analysis of the data, the Texas Election Commission is able to provide identifiable voting pattern information to the governor.
Methodology:
In order to efficiently identify whether or not clustering of certain voting patterns is occurring, and if these patterns are consistent over time, data is analyzed through spatial autocorrelations. Spatial autocorrelation analysis produce a spatial representation which can be used to identify whether or not the distribution of a variable indicates a systematic pattern over space. If clustering is occurring in voting patterns in the state of Texas, spatial autocorrelation will portray, not only if there is clustering or not, but also the areas in which clustering is occurring. Texas Election commission is also interested whether or not certain population variables influence possible clustering patterns. In addition to the percent democrat vote and voter turnout for 1980 and 2008, the percent Hispanic population is taken into consideration to examine if any relationship exists between certain voting patterns and fairly dense Hispanic population in Texas.
The data obtained through the Texas Election Commission provides information for the percent democratic vote and the voter turnout for both 1980 and 2008. The data for the 2010 Hispanic population was obtained through the US census bureau. In order to run spatial autocorrelations on all five of these variables, the data must be linked to a shapefile in order to produce a spatial representation. Once the data for all the desired variables are combined and joined to the shapefile of all the Texas Counties spatial autocorrelation maps can be produced using Geoda. The shapefile connected to the data for each variable can be uploaded into Geoda, where various autocorrelation statistics can be ran. In Geoda, both a Moran I scatter plot and a LISA cluster map were created for: percent democratic vote in 1980, percent democrat vote in 2008, voter turnout in 1980, voter turnout in 2008, as well as the percent Hispanic population in 2010.
The Moran I calculation compares the value of a variable at any one location with the value at all other locations and produces a number between -1.0 (weak clustering) and 1.0 (Strong Clustering) which determines the strength of the autocorrelation. Not only can Geoda produce a Moran I statistic, it also produces a scatterplot of four quadrants indicating where each observed value for the tested variable lies. Quadrants range from areas of with high values surrounded by areas of other high values of a certain variable (Quadrant I), to areas of low values surrounded by areas of other low values (Quadrant III), as well as areas of high values surrounded by areas of low values (Quadrant II), and areas of low values surround by areas of high values (Quadrant IV). Because areas closer to one another tend to be more similar than areas further away, most of the observed values for a variable will fall within quadrant I and III of the scatterplot. Values of a variable that fall within quadrant II and IV tend to indicate outliers in a situation, representing areas that are unlike the surrounding areas. The Moran I statistic is helpful in determining the strength of clustering patterns for certain variables, where the scatterplot helps identify details concerning clustering patterns.
The LISA cluster map is also generated through Geoda, and can be used in relation to the Moran I calculation. A cluster map was created for each variable which identifies specific areas where clustering of a particular variable are significant. The cluster map incorporates the placement of the value on the Moran I scatterplot and displays the exact locations of areas of high and low values in comparison to one another. The map helps to identify exactly where clustering occurs by representing where the areas of high values and areas of low values are located, as well as the location of certain outliers. After the Moran I calculation provides evidence for significant clustering, the LISA cluster map can put into perspective where the clustering is actually occurring.
In addition to spatial autocorrelation statistics represented through Moran I scatterplots and LISA cluster maps, simple correlation statistics are also useful in order to determine any relationship between certain variables. Significant correlations between certain variables, particularly between the percent Hispanic population and specific voting patterns, are useful for determining why clustering is occurring. A correlation matrix run through SPSS provides the correlation statistics comparing each of the five variables to one another in order to identify if of the variables has a strong linear relationship to one another. If there are significant correlations between certain variables, then those correlations can possibly explain the reason for certain voting patterns and clustering.
Results:
The data for the first variable of percent democratic vote in 1980 produced a fairly strong Moran I statistic of 0.5752. This statistic indicates there is evident clustering of percent democratic vote throughout the state of Texas in 1980. The Scatterplot produced in relation to the Moran I statistic reflects clustering of areas with high democratic votes surrounded by other areas of high democratic votes along with areas of low democratic votes to other areas with low democratic votes. The LISA cluster map portrays precisely where these high and low democratic voting areas in 1980 are located. The areas with a clustering of high democratic vote are apparent in the southernmost part of the state, along with a few areas to the eastern part of the state. The areas with very low democratic vote are located predominantly to the north and mid-western part of the state.


The data for the variable related to the percent democratic vote in 2008 produced similar results to the 1980 data in both the Moran I scatterplot and LISA cluster map. The Moran I statistic for democratic vote in 2008, though similar to the 1980 data, shows a slightly stronger spatial autocorrelation at 0.6957. The clustering in 2008 is slightly more apparent than in 1980, however areas of high democratic votes seem to still be surrounded by other areas of high democratic vote, and areas of low democratic vote are still surrounded by other areas of low democratic vote. In addition to the similarity between the Moran I statistics between 1980 and 2008, the location of clustering for democratic vote is also similar. It is still apparent that clustering of high democratic vote is still located towards the southernmost part of the state and areas of low democratic vote are primarily towards the northern part of the state.


The second variable concerning the data for voter turnout in 1980 was also analyzed through a Moran I scatterplot and LISA cluster map in order to identify noticeable clustering patterns. The results obtain through the Moran I calculation of 0.4681 indicate there is a considerable clustering pattern occurring in the state of Texas in regards to voter turnout in 1980. The scatterplot indicates significantly more outlier areas present for the voter turnout variable compared to the percent democrat vote variable. However, majority of the data represents clustering of areas of high voter turnout next to other areas of high voter turnout along with clustering of areas of low voter turnout surrounded by other areas of low voter turnout. The LISA map displays the exact locations where this clustering is occurring. The locations where there is consistent high voter turnout are primarily located at the northernmost part of the state, with a few areas towards the center of the state. The map also indicates the vast areas of low voter turnout are located at the southernmost part of the state, as well as a small area toward the midwest part of the state.


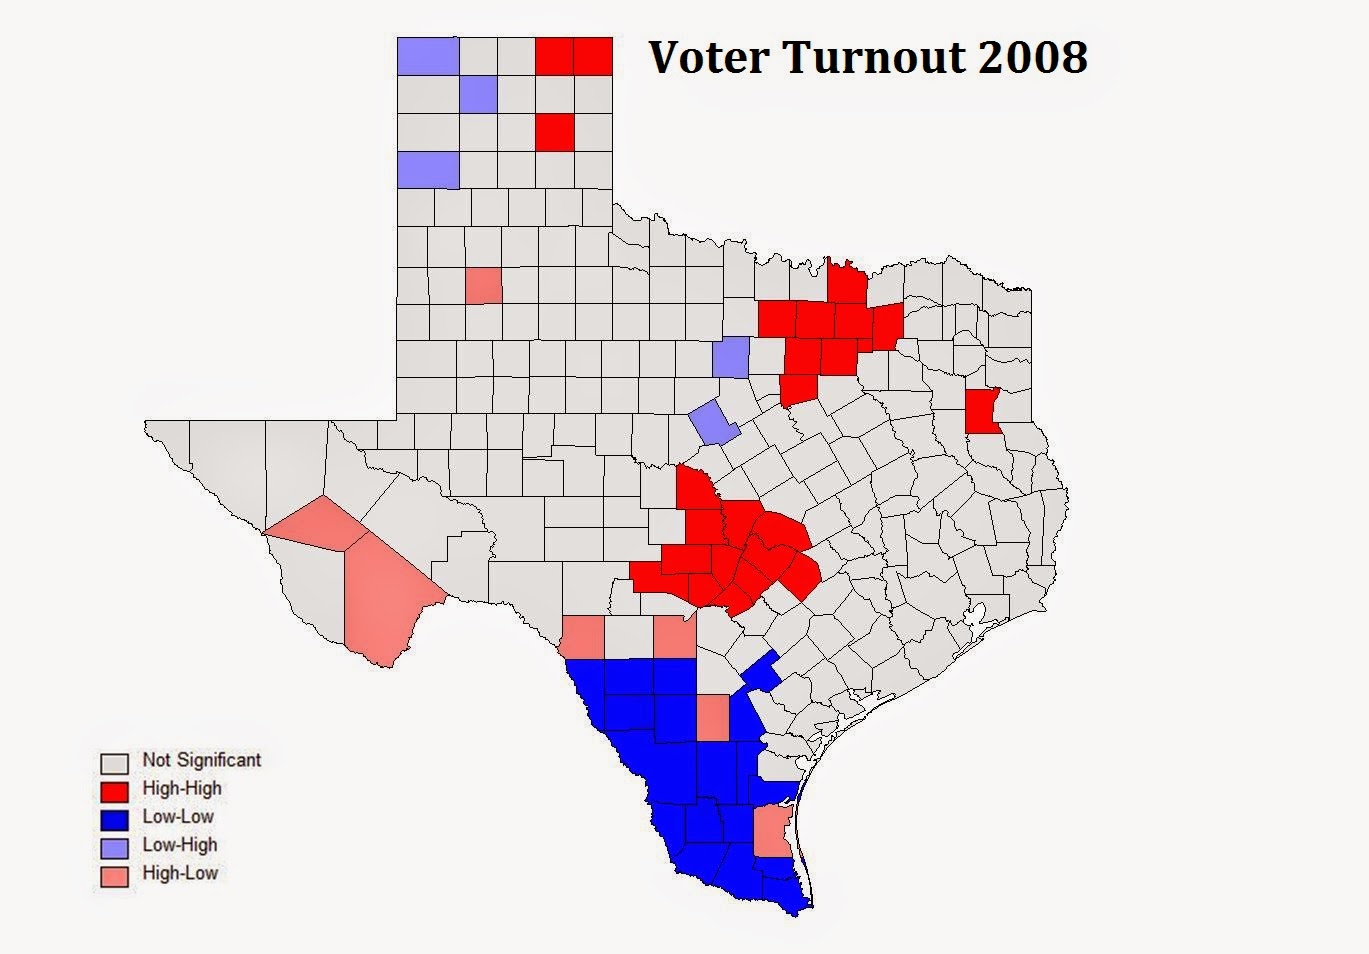
The voter turnout data for 2008 shows similar clustering patterns compared to 1980 in both the Moran I scatterplot and LISA cluster map. The Moran I value of 0.364 for voter turnout in 2008 is slightly less than of the Moran I value for 1980. Though the value indicates there is evident clustering occurring for voter turnout in 2008, the clustered areas for high voter turnout and low voter turnout are not as dense compared to 1980. The LISA cluster map for voter turnout displays clustered areas that are comparable to 1980. Even though there is noticeable clustering of high voter turnout in the northern part of the state during the 2008 election, in 1980 the northern part of the state had a much more expansive area of high voter turnout. There is still similar clustering of high voter turnout in various areas of central Texas in 2008 just as there was in 1980. In addition to similar clustering patterns for high voter turnout from 1980 to 2008, there is also consistent pattern for low voter turnout in the southern part of Texas. In 2008, southern Texas maintained significant area of low voter turnout, just as it did in 1980.

The final variable analyzed through a Moran I scatterplot and LISA cluster map was data concerning the percent Hispanic population throughout Texas in 2010. This data was used to identify if clustering of the Hispanic race is comparable to the identifiable clustering of certain voting patterns. The Moran I value of 0.78 indicates an extremely strong clustering pattern of the Hispanic population. There are very apparent clustering patterns of highly populated Hispanic areas as well as areas with very low Hispanic populations as indicated by the Moran I scatterplot. The LISA cluster map portrays the specific areas where high clustering of Hispanic population are present, and the areas where Hispanic population is very low. The map shows the entire southern part of Texas, along the Texas and Mexico border, there is a widespread area of high Hispanic population. In Contrast to this area, the north western part of Texas shows a vast area of very low Hispanic population. These clustering patterns can be examined in relation to particular clustering in voting patterns to indicate whether or not there is a relationship between the Hispanic population and particular voting patterns.


In addition to comparing the Moran I scatterplots and LISA cluster maps to identify a relationship between Hispanic population and voting patterns, results from a correlation matrix help solidify any observable relationships. The correlation matrix produced several statistically significant relationships between certain variables. The Pearson correlation statistic was statistically significant when comparing percent Hispanic population to all voting pattern variables, with expectation the percent democrat vote in 1980. The correlation statistic of 0.699 and significance level of 0 show a strong positive relationship between percent Hispanic vote and percent democrat vote in 2008. This indicates that the areas with higher clustering of Hispanic population are strongly related to the clustering of areas with high democratic votes. In addition to percent democratic vote there is also a strong relationship between Hispanic population and voter turnout in both 1980 and 2008. In both sets of election data a strong negative correlation is present, where in 1980 a correlation statistic of -0.47 was produced, and in 2008 a statistic of -0.668. These statistics are comparable to the cluster maps, indicating areas with high Hispanic population are sequentially areas with low voter turnout.

Conclusion:
The vast majority of the results indicate there is a definite clustering of certain voting patterns occurring in the state of Texas. Not only are clustering of voting patterns occurring, they also appear to remain consistent over time. The southern part of Texas shows a clustering of a high percentage of democratic votes in 1980. This clustering pattern for democratic votes has remained fairly consistent into 2008, and in fact appeared to expand further along with southern border. There is also an identifiable clustering pattern of low democratic in the northern part of Texas that has remained fairly consistent between 1980 and 2008. Strong clustering patterns are also evident in areas regarding voter turnout. The southern part of Texas seems to have maintained a pattern of low voter turnout from 1980 to 2008. These results suggest the occurrence of consistent clustering patterns where southern Texas is predominantly more democratic and has less of a voter turnout, and northern Texas is less democratic and has a significantly strong voter turnout.
In addition to these consistent patterns there is also a strong correlation between the percent Hispanic population in Texas and both percent democratic vote and voter turnout. The statistics indicate areas with larger Hispanic populations are also areas where there are a higher percentage of democratic votes in 2008. Both variables portray strong clustering along the southern border of Texas. The results of the correlation statistics also show a strong relationship to percent Hispanic population and voter turnout in both 1980 and 2008 elections. The results indicate areas with high Hispanic populations are similarly areas with low voter turnout. Both these variables, once again, fall along the southern Texas border. The results specify a strong relationship between Hispanic population and particular voting patterns, which is comparable to the cluster maps portraying southern Texas as an area of high Hispanic population and similarly an area of high percent democratic vote, as well as low voter turnout. Overall, the results are conclusive in both supporting the idea that the Hispanic population in Texas has a significant influence in particular clustering of voting patterns.
No comments:
Post a Comment